Should I Compare SLO County Housing Data with Last Month or Last Year?
October 19, 2026

October 19, 2026
Use both comparisons, but give them different jobs. Comparing the same month a year earlier can help you put seasonal changes in context. Comparing consecutive months can show a recent change in direction, but it needs more caution. Neither comparison, by itself, tells you what your SLO County home is worth.
If you're deciding when to sell, the goal isn't to find the most encouraging percentage. It's to understand what the report actually measures, then connect that information to the homes competing with yours.
I'm Amber Johnson, founder of Pillar Real Estate in Paso Robles. I help San Luis Obispo County homeowners make selling decisions based on their property, location, and next move. A useful market conversation starts with a clear comparison, not a headline that leaves out half the explanation.
Before choosing last month or last year, ask what you're trying to learn. Are you checking whether activity changed recently? Whether the market differs from the same season last year? Or whether you should adjust your listing plan?
Those aren't identical questions. A month-to-month sales comparison looks at a short interval. A same-month year-over-year comparison looks across a longer interval while keeping the calendar month consistent. Your listing decision needs more than either interval alone.
Write down the question in plain language. For example: “Do the current alternatives to my home support my proposed asking price?” That keeps a county report in its proper role. It provides context, while the property-level comparison does the more specific work.
A buyer can use the same approach. “Is this home a reasonable fit at this price?” is more useful than trying to prove that every seller in the county should accept a discount.
Keep the source, geography, property type, and metric consistent. Don't compare one report's detached-home median with another report's figure combining several property types. A matching dollar sign doesn't make the measures interchangeable.
The California Association of REALTORS® defines month-to-month change as a comparison with the preceding month. Its year-to-year measure compares the same month of the previous year. Year-to-date uses cumulative activity through the same point in each year, which is a different comparison again.
Also check the geographic boundary. San Luis Obispo County is not the same search area as San Luis Obispo city. A county total shouldn't quietly become a statement about one neighborhood in Paso Robles, a particular coastal condo, or a rural property.
Our article on using countywide market data for a local buying or selling decision explains that location issue in more detail. For a time comparison, the immediate rule is simple: don't change the area between the two periods.
Comparing the same calendar month a year earlier gives you a better starting point for considering recurring seasonal influences than comparing two different seasons. That doesn't remove every difference between the periods. It just avoids one obvious mismatch.
If you're looking at a September report, compare September with the prior September before deciding what a change means. Comparing September with August can still be informative, but it asks a different question.
Be particularly careful with median sale prices. C.A.R. cautions that the types and sizes of homes sold can affect the median. A change in that middle sale price should not be treated as the price change of a particular home.
That matters when you're a seller. A county median moving in either direction doesn't establish that your own asking price should move by the same percentage. Your home's condition, usable features, location, and competing choices still need review.
Year-over-year isn't a guarantee of a clean comparison, either. Ask whether the earlier period was unusual and whether the mix of sales changed. A comparison has two sides. The starting point matters as much as the ending point.
Month-to-month information can prompt a useful question: is something changing that deserves a closer look? It is less useful when one movement becomes a confident prediction about what will happen next.
Read several consecutive periods from the same series. Notice whether the latest movement continues an earlier pattern or reverses it. Keep the underlying values alongside the percentages so you can see what actually changed.
Then check whether the series is seasonally adjusted. The U.S. Census Bureau describes seasonal adjustment as estimating and removing recurring seasonal effects to make other patterns easier to see. Don't assume every local housing chart uses that process.
A seasonally adjusted national series and an unadjusted local series aren't interchangeable. Read each report's notes rather than applying the explanation from one chart to another. Seasonal adjustment also isn't a promise that every unusual event has been removed.
For a homeowner preparing to list, a short-term change is a reason to refresh the property comparison. It isn't a reason to abandon your plan before checking the homes buyers can actually choose today.
A report released this month may describe activity from an earlier month. Read the period covered before calling a number current. The publication date tells you when the report arrived, not necessarily when the underlying transactions happened.
For a date-specific example, an October 2026 release describing September 2026 activity would be compared with August 2026 for a monthly change. Its same-month annual comparison would use September 2025. That's a calendar example, not a claim about any actual SLO County results.
Also check for preliminary figures, revisions, and changes in definitions. If the source revises the prior period, use the matching updated series. Don't combine a revised current report with an old screenshot and assume they use identical information.
Save the report name, release date, period, and relevant notes with your comparison. That makes it much easier to answer a basic follow-up question: “Where did this number come from?”
A percentage tells you relative change, not the size of the activity behind it. Request the actual counts where they're available. That is especially important when narrowing a county report to a smaller area or property category.
A small group of transactions gives you less room to treat the result as a description of every home. Look at the properties included, not just the percentage printed above them. If the source doesn't provide enough detail, keep that limitation in your conclusion.
Our discussion of interpreting a small number of recent Avila Beach sales addresses that concern. The time interval doesn't solve a thin comparison. Both monthly and annual changes still need enough relevant context.
Be careful about widening the area just to make the number look more substantial. You may gain transactions while losing relevance. It's better to acknowledge a limited comparison than present a larger but poorly matched one as precise.
Sometimes the monthly comparison points one way and the annual comparison points the other. That isn't automatically an error. Each uses a different starting period, so the two statements can describe different parts of the same sequence.
Don't choose whichever result supports what you already want to do. Go back to the underlying series and read the periods in order. Check the metric, adjustment notes, and actual values before deciding whether the difference is meaningful.
Separate observation from explanation. “This measure changed between these periods” is an observation. Saying a specific event caused it requires additional evidence. A chart alone doesn't establish why people bought, sold, or changed their plans.
For more background, our article on seasonality in home-price appreciation discusses recurring calendar patterns. Treat it as background education, not proof that the same pattern must repeat in every SLO County community or year.
Once the report is clear, ask what you would do differently because of it. If the answer is nothing, it may be useful background rather than the deciding factor in your move.
For pricing, review relevant recent sales alongside the current alternatives to your home. For preparation, consider which condition issues or features matter in that comparison. For timing, include your own deadlines and the practical needs of your next purchase.
A move-up seller also needs to consider both transactions. A broad headline about sale prices doesn't explain the relationship between the home you're selling and the one you want to buy. Review those two situations separately before drawing a conclusion about the move.
That's the local work behind a useful recommendation. At Pillar Real Estate, I don't want a county percentage to replace a conversation about your goals. I want the data to help us ask better questions about your actual options.
Start by identifying the source, release date, reporting period, area, and property type. Then confirm the exact measure. Keep the comparison periods consistent and check whether seasonal adjustment is part of the series.
Read the same-month annual comparison for seasonal context. Read the monthly comparison for a possible recent change, with its limitations in mind. Look at the actual values, available counts, and several periods before describing a trend.
Finally, connect the findings to your property and plans. You don't have to choose one interval and ignore the other. You need to understand what each comparison can tell you and where it stops being specific enough to guide your decision.
If you're considering selling in Paso Robles or elsewhere in San Luis Obispo County, visit Sell With Amber. We can put the report beside your home's real competition and talk through what makes sense for your goals.
Amber
Pillar Real Estate | Amber Johnson, Founder
805.835.3425 | [email protected]
1345 Park St. Paso Robles, CA 93446 | DRE# 01925434

Amber Johnson | November 10, 2026
Learn what each listing outcome may mean, what it leaves unanswered and how price range, location and timing affect the comparison.

Amber Johnson | November 9, 2026

Amber Johnson | November 9, 2026
Review inspection findings, service records, capacity, access and local requirements before relying on the system.

Amber Johnson | November 8, 2026
Compare access, timing, seasonal conditions and home-to-trail logistics before building regular birdwatching into life in Los Osos.
Amber Johnson | November 8, 2026
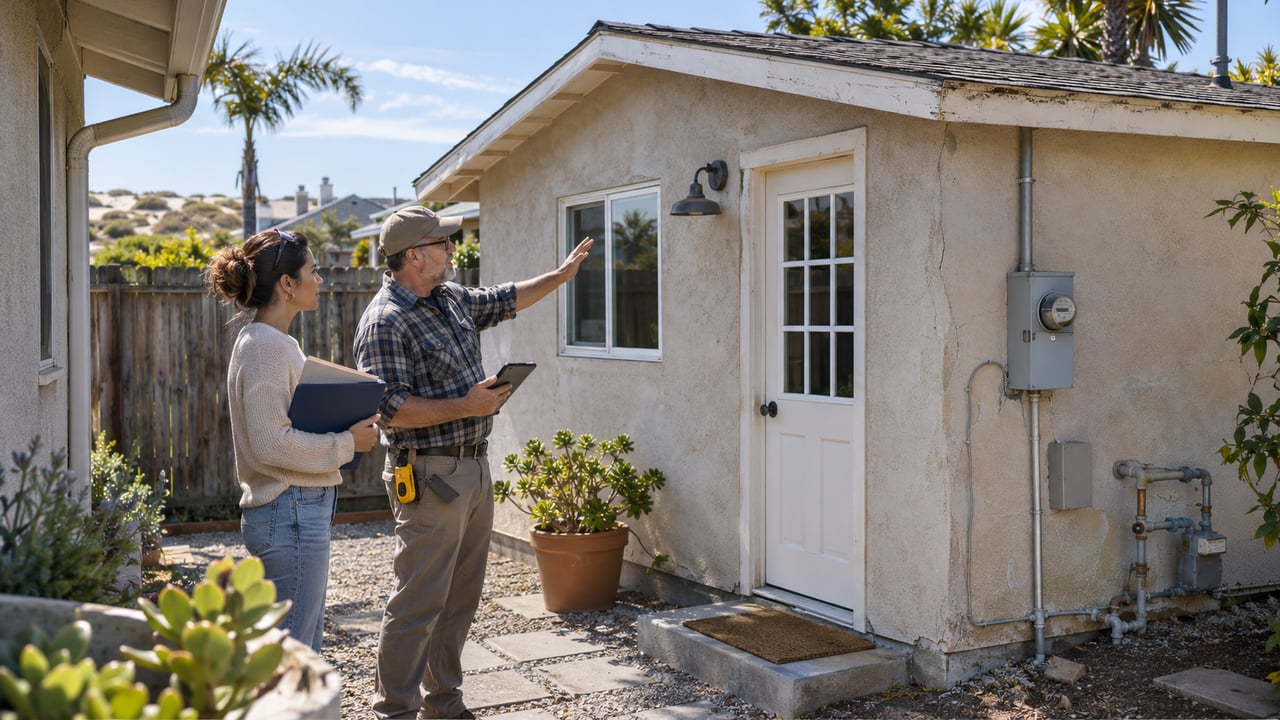
Verify the separate structure's records, condition and permitted use before counting on it.

Amber Johnson | November 7, 2026
Compare specific homes by their street setting, daily routes and access to the places you use.

Amber Johnson | November 7, 2026
Test school logistics, activities and daily routes from the specific home you are considering.

Amber Johnson | November 7, 2026
Amber Johnson | November 7, 2026
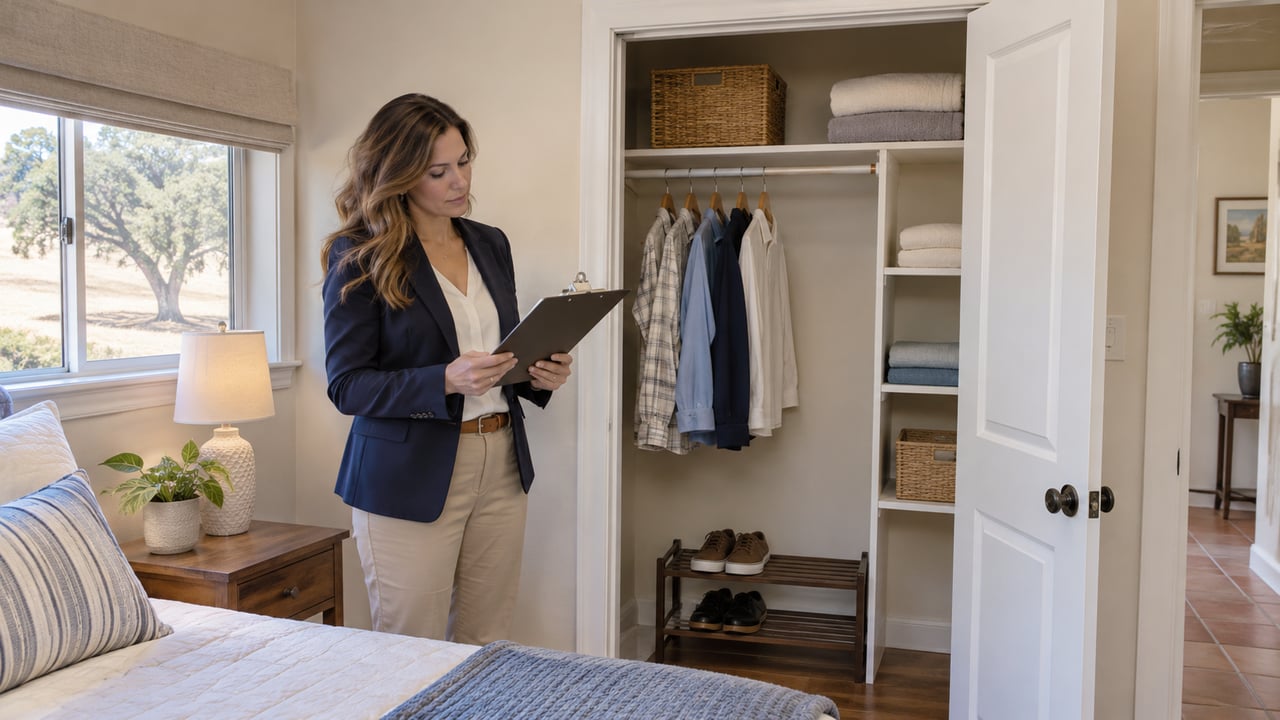
Show usable storage honestly and help buyers see how the home's layout fits daily life.
You’ve got questions and we can’t wait to answer them.

Amber Johnson, Founder
Pillar Real Estate
805.835.3425
DRE# 01925434
1345 Park Street
Paso Robles, CA 93446